
Ever felt like you’re working hard to improve customer experience but still not sure if it’s paying off? I’ve been there too – staring at numbers, wondering what’s really moving the needle. Well, let me save you the trouble. If you’re looking to really understand how your customers feel and where to focus your efforts, you need the right KPIs.
These 7 Customer Experience KPIs are like your north star – guiding you to better decisions and happier customers. Let’s dive in!

Imagine embarking on a journey where every step, every interaction, shapes your perception. This journey, intricate and multi-dimensional, is what businesses call ‘Customer Experience’ (CX). It’s the sum of all interactions a customer has with your brand, from the first click on your website to the after-sales service. In today’s digital landscape, crafting an exceptional CX is the cornerstone of brand loyalty and customer retention. Understanding this concept is the first step in mastering the art of customer experience KPIs.
The significance of customer experience (e.g., in the context of retail customer experience ) cannot be overstated. Creating positive and memorable experiences for customers is paramount in fostering satisfaction and loyalty. Research reveals that 90% of customers who express high satisfaction with a brand are not only inclined to return but also exhibit a strong likelihood of making repeat purchases. This elevates CX from a mere buzzword to an essential business strategy. A stellar customer experience not only garners loyalty but also fosters brand advocacy.
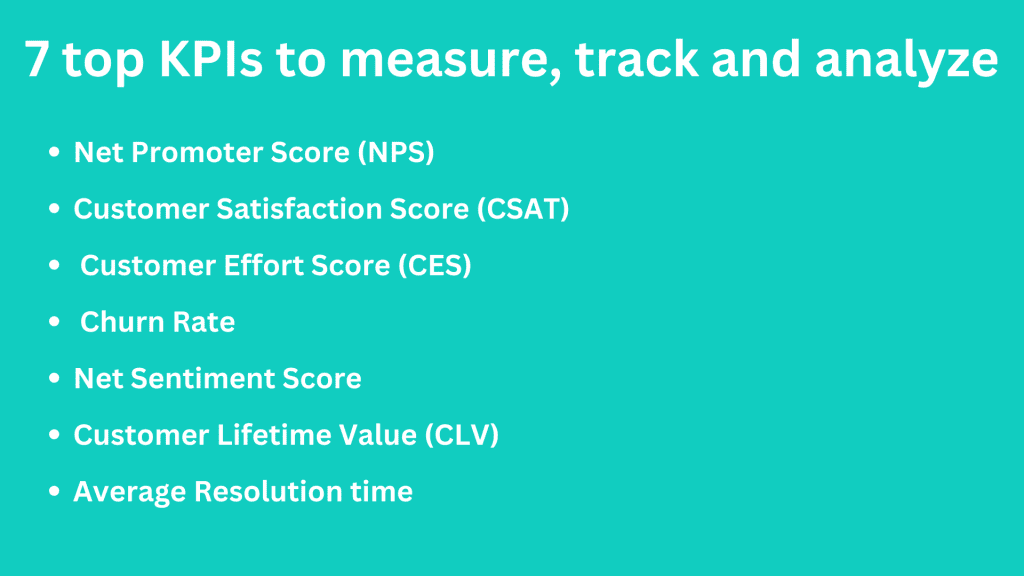
To enhance CX, one must delve into specific KPIs that shed light on the customer journey. These metrics are not just numbers; they are insights into your customer’s heart and mind.

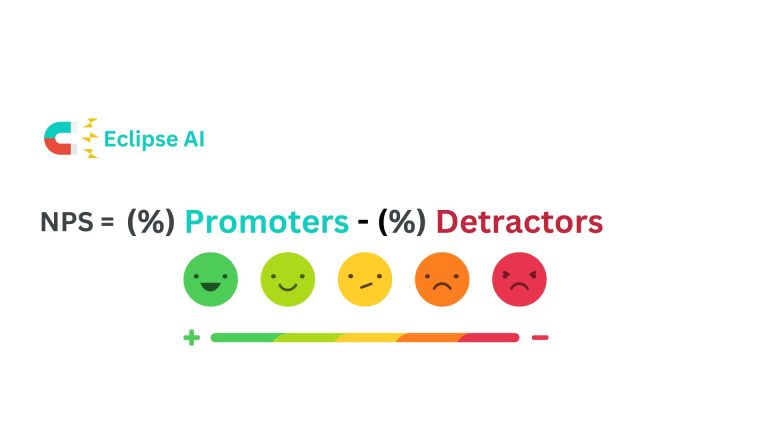
Let’s start with a classic: Net Promoter Score (NPS). It’s that simple question: “How likely are you to recommend us to a friend?” – and trust me, it tells you a lot more than you think!
NPS measures customer loyalty and likelihood to recommend your brand. It categorizes customers into Promoters, Passives, and Detractors.
NPS helps you spot your promoters (the cheerleaders) and detractors (the ones not so happy). Why does this matter? Because it gives you a real-time pulse on customer loyalty. Plus, your promoters? They’re the ones who will talk you up to others, bringing in more business organically. 🙌
Ask customers, “On a scale of 0-10, how likely are you to recommend our brand to a friend or colleague?” Scores 0-6 are Detractors, 7-8 Passives, and 9-10 Promoters.

Ah, good ol’ CSAT. This one’s pretty straightforward – you ask customers how satisfied they are with a specific interaction, like a product purchase or a service call.
Think of CSAT like a “check-in” with your customers. If something went wrong, this score will alert you before it spirals into a bigger issue. And when it’s high? Well, that’s your green light that you’re doing something right. 🚦
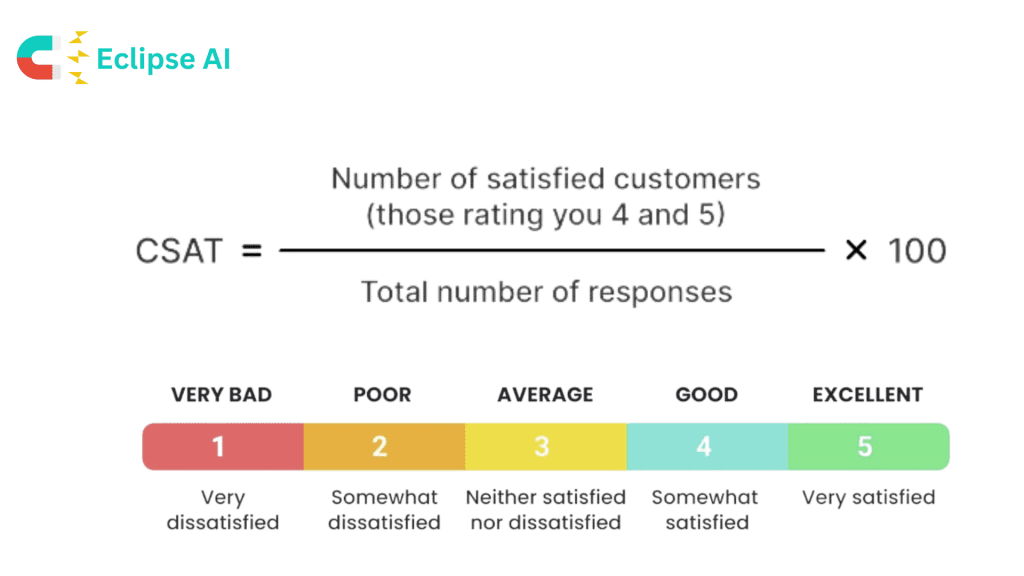

A higher score indicates greater customer satisfaction. Aim for a score above 75%.
Use post-purchase or post-interaction surveys via email, SMS, or directly on your website.
Here’s a question – how easy is it for your customers to interact with you? That’s what Customer Effort Score (CES) measures.
When you make things easy for your customers (whether it’s finding information, completing a purchase, or getting support), they’re far more likely to stay loyal. Think about it – nobody likes a complicated process! CES helps you find out where you might be unintentionally putting roadblocks in your customers’ path. 🛑
Why track it: Reducing effort = happy, loyal customers who keep coming back.
Churn Rate indicates the percentage of customers who stop using your service over a given period.
Churn hurts. If you’re not familiar with Churn Rate, it’s the percentage of customers who stop doing business with you over a set period of time.
Every lost customer is a missed opportunity, so tracking churn is critical. It shows you if customers are leaving at a higher-than-expected rate and can point to underlying issues, like a bad product experience or lackluster support. If churn’s high, it’s time to dig deeper into why. 🕵️♀️
Net Sentiment Score measures overall customer sentiment across various channels. Analyze customer feedback across platforms, categorize as positive, negative, or neutral, and calculate the score as the percentage of positive feedback minus the percentage of negative feedback.
CLV is the total revenue you can expect from a customer throughout their relationship with your brand.
If you’re in it for the long game (and who isn’t?), then Customer Lifetime Value (CLV) is one of the most important KPIs to track. CLV measures the total revenue you can expect from a customer over the course of their relationship with your company.
High CLV? That’s a sign your customers are sticking around and spending more over time. Low CLV? You’ve got some work to do to improve loyalty and long-term satisfaction. 💡
Average resolution time measures the average time taken to resolve customer issues.
Customers hate waiting – that’s a fact. Average Resolution Time tracks how long it takes for your team to resolve a customer issue. The faster you solve problems, the happier your customers will be.
But it’s not just about speed – it’s about efficiency, too. If you’re handling issues quickly and effectively, customers will feel valued. And if resolution times are dragging on? Well, that’s a sign to streamline your processes.
Effectively managing these KPIs requires advanced tools. Eclipse AI collects the voice of customer data (online reviews, surveys, customer calls, tickets) and leverages AI to analyze and generates actionable insights allowing businesses to measure, track, and analyze KPIs effectively.
Related Readings:
Best Customer Experience Analytics Tools to Delight your Customers
Optimizing customer experience KPIs is about customer experience transformation by turning data into meaningful customer relationships. By effectively measuring, tracking, and analyzing these KPIs, businesses can not only meet but exceed customer expectations. As we continue to evolve in this dynamic consumer landscape, ask yourself: Are your efforts in enhancing customer experience in line with the insights these KPIs provide?
Don’t forget to share this post


Don’t Let Your Competitors Understand Your Customers Better Than You
Don’t miss out. Try our 30-day Free Professional Trial.
