
Customer Insights Across Multiple Venues: Strategies for Success
In the ever-evolving landscape of multi-venue businesses, the ability to gather and apply customer insights across diverse locations is a game-changer.
Standing at the data crossroads, do you go with hard numbers or human stories? It’s the classic quantitative vs. qualitative debate. In “Balancing Acts: When to Use Quantitative vs. Qualitative Data” we’re simplifying this choice. Discover the strengths of each data type and learn how to mix them for the ultimate insight cocktail. Whether you’re shaping marketing strategies or simply aiming for deeper understanding, this guide will make data your sharpest decision-making tool. Ready for a journey into the heart of data analysis? Let’s dive in.
Quantitative data is like the backbone of data-driven decisions, giving you the hard numbers to track, measure, and analyze everything under the sun. Think of it as the digital pulse of your business or project—whether it’s the number of clicks on your latest post, the speed at which your website loads, or even the exact temperature of your morning coffee. It boils down to anything and everything that can be counted or measured with precision.
In the grand landscape of data, quantitative data splits into two exciting terrains:
Picture this as the headcount at your favorite concert. It’s all about numbers that stand firm, like the number of ice cream scoops in your bowl (because who’s really sharing?) or the exact tally of books on your shelf.
This is more like measuring the melody of a song. It flows and can fill any space within a range, from the length of your morning run to the volume of your playlist.
Quantitative data is your ticket to turning observations into insights. Whether you’re optimizing your website, forecasting sales, or just trying to figure out the best time to drink that coffee for maximum warmth, it’s all about the numbers. And in a world that’s increasingly data-driven, mastering the art of quantitative data is not just smart; it’s essential. Ready to dive into the numbers game? Let’s count the ways.
Qualitative data is like the stories behind your favorite photos. It’s not about how many pictures you took or how big they are; it’s about the memories they hold, the feelings they stir up, and the colors of life they capture. This type of data lets us dive into the why and how—getting to the heart of experiences, thoughts, and feelings.
Think of it as chatting with friends, reading heartfelt reviews, or watching a video that moves you. It’s the words people use, the things they notice, and the emotions they express. It’s about:
From interviews and open comments to tweets and stories, where every phrase tells a part of a bigger picture.
Watching the world in action, like noticing smiles in a cafe or the calm in a library, gives us clues about the world.
A single image can tell a story that numbers can’t, from the mood of a painting to the message in a photograph.
Qualitative data is our window into the human side of things, reminding us that behind every statistic, there’s a story waiting to be told. It’s about understanding not just what is happening, but why it matters. So let’s lean in and listen to the stories data can tell, because sometimes, the most valuable insights come from simply paying attention to the world around us.
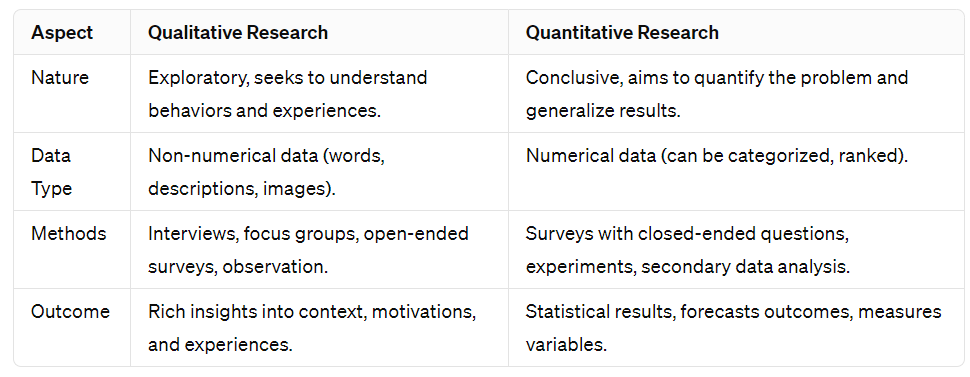
The difference between qualitative and quantitative data lies in their core approach and the type of data they collect:
Qualitative research is exploratory and seeks to understand human behavior, beliefs, feelings, and experiences. It delves into the ‘how’ and ‘why’ of decision processes, not just what, where, when.
It collects non-numerical data, using words, descriptions, images, or symbols to depict the subject of study in a detailed and comprehensive manner.
Common methods include interviews, focus groups, open-ended surveys, and observation. The data analysis involves identifying patterns, themes, and narratives.
The outcome is rich, deep insights that provide a detailed understanding of the context, motivations, and experiences of the research subjects.
Quantitative research is conclusive and aims to quantify the problem by generating numerical data or data that can be transformed into usable statistics. It seeks to quantify variables and generalize results from a larger sample population.
It collects numerical data through measurable forms, which can be categorized, ranked, or put into models and statistical analysis.
Common methods include surveys with closed-ended questions, experiments, and analysis of secondary data. It employs statistical, mathematical, or computational techniques for analysis.
The outcome is statistical, generalized results that can forecast outcomes, measure variables, and establish relationships between them.


Free Top 4 Customer Satisfaction Survey Templates
What is an example of qualitative data? Qualitative data dives deep into experiences, opinions, and emotions, offering insights that numbers alone can’t capture. It’s about the rich, descriptive details that paint a full picture of a situation or opinion. Here are some bullet-pointed examples:
Personal Interviews: Detailed personal stories and experiences shared during an interview, capturing feelings and perspectives.
Open-Ended Survey Responses: Textual responses where individuals express their thoughts and feelings about a service or product in their own words.
Focus Group Discussions: Conversations among a group about a specific topic, capturing a range of opinions, attitudes, and experiences.
Observation Notes: Descriptive notes taken while observing behavior in natural settings, noting interactions, expressions, and environments.
Diary/Journal Entries: Personal reflections written over time, offering insight into the writer’s thoughts, feelings, and changes in perspective.
Photographs and Videos: Visual media that captures moments, expressions, and environments, telling a story beyond what numbers can convey.
Each of these examples showcases the depth and dimension qualitative data brings to research, allowing us to understand the “why” behind the “what.”
Quantitative data refers to numerical information that can be measured and quantified. Here are some examples:
A survey can be both qualitative and quantitative, depending on the nature of the questions it includes and the goals of the research.
Quantitative Surveys: These surveys contain closed-ended questions such as multiple choice, rating scales, or yes/no questions. They generate numerical data that can be easily quantified and analyzed statistically. The focus is on measuring and counting responses to obtain statistically significant results.
Qualitative Surveys: These surveys include open-ended questions that allow respondents to answer in their own words, providing depth, opinions, emotions, and insights into their thoughts. The data collected is textual and is analyzed for themes, patterns, and narratives rather than numbers.
In many cases, surveys are designed to include both types of questions to gather comprehensive data that offers both the measurable scale of quantitative data and the detailed depth of qualitative insights.
Quantitative data, gathered through rating scales, multiple-choice questions, or numerical inputs, offers the clarity and simplicity of numbers. It’s like taking the temperature of your customer base—quick, straightforward, and easy to analyze. With it, you can effortlessly track satisfaction levels, measure service quality, or quantify demand for a new feature. This data helps businesses make decisions that are backed by solid stats, providing a clear direction for improvements or changes.
On the flip side, qualitative data comes from open-ended questions, interviews, or feedback forms, offering a narrative that brings customer experiences to life. It’s the story behind the score, providing context to the numbers. This data dives into the “why” and “how,” revealing the emotions, suggestions, and words directly from the customer’s mouth. It uncovers the nuances behind behaviors and preferences, offering insights that numbers alone cannot.
Blending both types of data in customer surveys creates a powerful tool for understanding your audience. Quantitative data offers the broad strokes, while qualitative data fills in the details, painting a complete picture of your customers’ experiences and expectations. Together, they equip businesses with the knowledge to not only meet but exceed customer needs, fostering loyalty and driving growth.
In essence, whether it’s through the precision of numbers or the richness of narratives, customer surveys are about listening and responding to your audience. By valuing both quantitative and qualitative data, businesses can ensure they’re not just hearing but truly understanding what their customers are saying.


In the ever-evolving landscape of multi-venue businesses, the ability to gather and apply customer insights across diverse locations is a game-changer.


From the seamless blend of technology and personalization to real-world success stories like Nike’s innovative strides, learn how brands are redefining engagement in the digital realm.


In the era of data-driven decision-making, businesses are increasingly recognizing the pivotal role of customer data consolidation in shaping a seamless and personalized customer experience.
Don’t Let Your Competitors Understand Your Customers Better Than You
Don’t miss out. Try our 30-day Free Professional Trial.

