Customer Journey Map: Your Clear Guide to Customer Happiness
Understanding customer journey mapping from wide-eyed discovery to post-purchase bliss (or frustration), is the key to building stronger relationships and boosting your business.

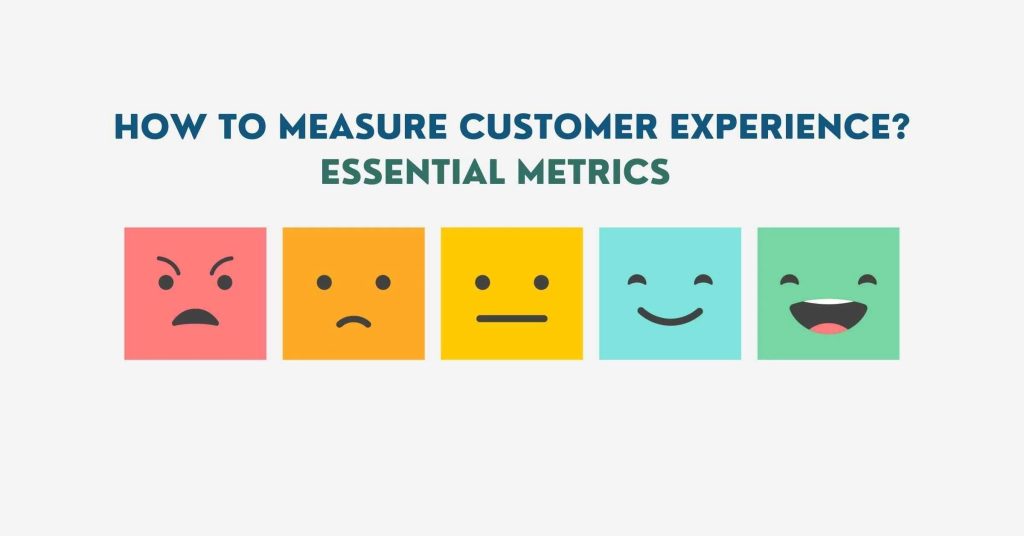
Customer experience (CX) is critical for businesses’ success in today’s competitive marketplace. CX refers to customers’ overall perception of a company, based on their interactions with its products, services, and customer support. It is a crucial indicator of how likely customers are to return to your product or service or recommend it to others.
To measure CX effectively, businesses must track key metrics that can help them identify areas for improvement and make data-driven decisions.
In this blog post, we will discuss ten CX metrics that all businesses must track to gauge how the customer experience improves or deteriorates over time.
The significance of tracking CX metrics lies in the fact that it has two crucial benefits for any business:
Since CX encompasses various touchpoints, including website navigation and customer support chats, tracking CX metrics can also align different teams in the company, fostering empathy towards customers and focusing on enhancing their overall experience.
The CSAT measures the level of satisfaction customers have with a specific product, service, or interaction. It is usually measured by asking customers to rate their satisfaction with a product or service on a scale of 1-5 or 1-10. CSAT surveys can be conducted via email, phone, or website, and the data can be used to identify areas for improvement.
CSAT is calculated by adding up the number of 4 and 5 ratings, dividing by the number of responses, then multiplying by 100.
Compare your CSAT against industry competitors with our benchmarking calculator.
The NPS measures customer loyalty by asking customers how likely they are to recommend a product or service to others. It is measured on a scale of 0-10, with customers who score 9-10 considered “promoters” and those who score 0-6 considered “detractors.” The NPS is calculated by subtracting the percentage of detractors from the percentage of promoters.
Compare your NPS® against industry competitors with our benchmarking calculator.
The CES measures the level of effort that customers have to exert to complete a particular task or interact with a company. It is usually measured by asking customers to rate the level of effort on a scale of 1-5 or 1-10. CES surveys can be conducted after specific interactions, such as customer support calls or website purchases.
The goal should be to achieve a high CES—a low Customer Effort Score means customers either find your product/service difficult to use or customer support unhelpful. Asking a follow-up question on low CES ratings will help you find out what’s creating friction in their journey.
Compare your customer effort score against industry competitors with our benchmarking calculator.
Forget about reading through thousands of voice of customer data points.
Let our AI-powered ‘Insight Assistant’ flag the issues that matter so you can work faster, boost productivity, and save more time.
The FCR measures the percentage of customer issues that are resolved on the first contact with customer support. A high FCR indicates that the customer support team is efficient and effective, while a low FCR indicates that customers may have to contact the company multiple times to resolve their issues.
Compare your FCR score against industry competitors with our benchmarking calculator.
The AHT measures the average time it takes for customer support agents to resolve customer issues. A low AHT indicates that the customer support team is efficient and effective, while a high AHT indicates that customers may have to wait longer to resolve their issues. AHT can be measured in hours or days. It’s calculated by totaling up the duration of all customer conversations and dividing the result by the number of customer chats or tickets.
Generally, the quicker the AHT, the more likely a customer is to be satisfied and have enjoyed a positive experience with your service or product.
Compare your AHT against industry competitors with our benchmarking calculator.
The CRR measures the percentage of customers who continue to use a company’s products or services over time. A high CRR indicates that customers are satisfied and loyal, while a low CRR indicates that customers may be switching to competitors.
By keeping track of your CRR, you can get a better sense of customer experience by tracking certain points in your product life cycle. You’ll get an understanding of how much users value your product or service over a given period and have the chance to make improvements. This is very worthwhile, as it’s far more expensive to onboard new customers than it is to keep current ones.
There is more than one way of calculating your retention rate. One is to subtract the number of customers who churn in a given duration from the number of customers who stay loyal.
80% retention – 20% churn = 60%
Retention rate Another way is to look at how many customers stay loyal for one period of time, vs another period.
% of customers in period one / % of customers in period two = retention rate
Compare your customer retention rate against industry competitors with our benchmarking calculator.
The opposite of retention rate. Churn Rate measures the percentage of customers who stop using a company’s products or services over time. A high churn rate indicates that customers are dissatisfied or switching to competitors, while a low churn rate indicates that customers are satisfied and loyal.
The customer churn rate can be calculated with this formula: No. of customers at the beginning of a period –
No. of customers at the end of that period / No. of customers at the beginning = churn rate
Compare Churn Rate against industry competitors with our free calculator
The CLTV measures the total value of a customer over the entire time they remain a customer. It takes into account the customer’s purchasing history, the cost of acquiring the customer, and the estimated future value of the customer.
SaaS companies measure LTV by dividing MRR (monthly recurring revenue) by the total number of client accounts, then dividing the result by the user churn rate.
E-commerce companies measure LTV by multiplying the average order value by purchase frequency and estimated customer lifespan.
LTV is also a revenue metric. It’s still relevant here because it represents customer loyalty and satisfaction: the more satisfied your customers are, the more likely they are to buy from you again and stay subscribed, which increases their LTV and, ultimately, your revenue.
Compare your CLTV against industry competitors with our benchmarking calculator.
The RPR measures the percentage of customers who make repeat purchases from a company. A high RPR indicates that customers are satisfied and loyal, while a low RPR indicates that customers may be switching to competitors. To measure RPR, divide the No. of repeat customers by the No. of total customers, and then multiply the result by 100.
Compare your Repeat Purchase Rate against industry competitors with our benchmarking calculator.
The CAC measures the cost of acquiring a new customer, including marketing and sales expenses. A low CAC indicates that the company is efficient at acquiring new customers, while a high CAC indicates that the company may need to adjust its marketing and sales strategies. CAC is calculated by dividing the total cost of sales and marketing by the no. of new customers acquired.
Compare your Customer Acquisition Cost against industry competitors with our benchmarking calculator.
Tracking CX metrics is essential for businesses to understand their customers’ perceptions, identify areas for improvement, and make data-driven interventions.
Not only will these metrics allow you to better understand your user journey, but they will also give you actionable insights into how to improve the product. This can have huge benefits for your company as a whole, such as decreasing your churn rate, or driving up your retention and paid subscribers.
In addition, you’ll also be able to see where your teams are performing most efficiently, and where there’s room for improvement. The same holds for your products and their functionality. The more you know about how your customers are using your product, the more positive interventions you can make, and the more enjoyable you can make their experiences.
Ready to take your customer experience to the next level and harness the power of these CX metrics?
Contact us now to learn how our expertise can help transform your business.
Want The Latest CX Intelligence?
Analyse all your voice of customer data in one place and empower your teams with actionable insights that help them understand the true voice of your customers.
✔Free forever ✔ No credit card needed ✔ Reduce Churn


Understanding customer journey mapping from wide-eyed discovery to post-purchase bliss (or frustration), is the key to building stronger relationships and boosting your business.

In today’s highly competitive business landscape, providing exceptional customer experiences (CX) is paramount for companies looking to thrive.

Multi-location businesses, such as restaurant chains, retail franchises, and global hotel brands, often span diverse cultural landscapes.
Don’t Let Your Competitors Understand Your Customers Better Than You
Don’t miss out. Try our 30-day Free Professional Trial.
